2020 was an incredible year for decentralized exchanges, with Uniswap surpassing Coinbase in trading volume in September of 2020. This has caused more investors to get interested in liquidity pools, part of the AMM model of Uniswap. Many are drawn to providing liquidity with attractive farming rewards, but that is only one part of the equation. This article helps understand the various factors to consider when providing liquidity to Uniswap style AMM’s.
Key profit metrics for Liquidity Providers
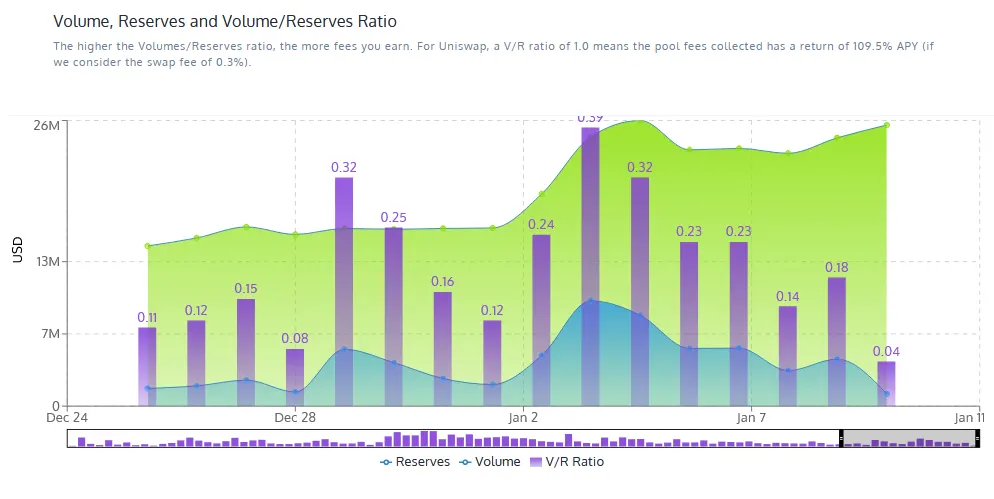
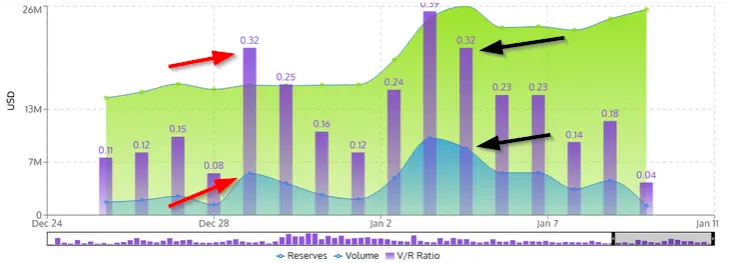
Chart showing recent performance of AAVE/ETH pool provided by APY.Vision
Trading Volume
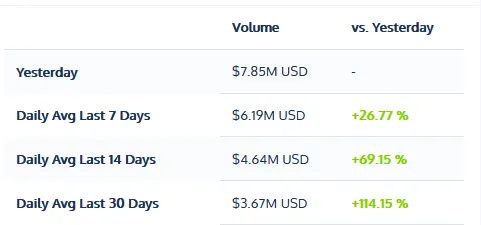
Recent Volume from the AAVE/ETH pool on Uniswap
Swap fees drive revenue
A pool with a popular token pair can have high volume, which leads to higher fees. On Uniswap each trade is charged a 0.3% protocol fee that is split evenly among the liquidity providers in the pool according to what share of the pool they own. High volume means more trading, which in turn generates more revenue for the pool. Your share of those fees is dictated by what percentage of the pool you own. The profitability of the pool based on volume and reserves is illustrated with the V/R (Volume/Reserves) ratio in the graph above.
A popular saying goes, “Time in the pool beats timing the pool,” as it can be difficult to time periods of high volume as they can correspond with any number of external events like a surprise token launch or a big swing in the macro market.
Liquidity pool reserve size
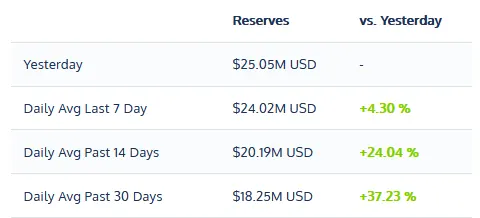
Recent Reserve Size from the AAVE/ETH pool on Uniswap
Larger reserves mean you have to share fees with more people
A pool with large reserves is less profitable from fees but more protected from slippage as there is plenty of liquidity to fill large orders. The larger reserve pools tend to be a more conservative choice as some of the risks are reduced. Your order is less likely to be front-run in a pool with a large reserve.
Trading Volume/Pool Size Ratio
Higher the ratio, the higher the returns
Look at the red arrows above pointing to the .32 VR ratio and the spike in the blue area of the graph representing volume. As you can see, when volume spikes and there is no corresponding spike in reserve size, your fee revenue goes up considerably. If you look at the black arrows, you can see that with a larger reserve size (the green area) it takes more volume to make the same .32 VR ratio profit.
A V/R ratio of 1 means the pool is returning 109% APY for that period (based on the swap fee of 0.3%). The V/R ratio fluctuates based on trading volume and the amount of liquidity provided to the pool. Just like with any business, with liquidity pooling, some days can be more profitable than others.
Key risk metrics for Liquidity Providers
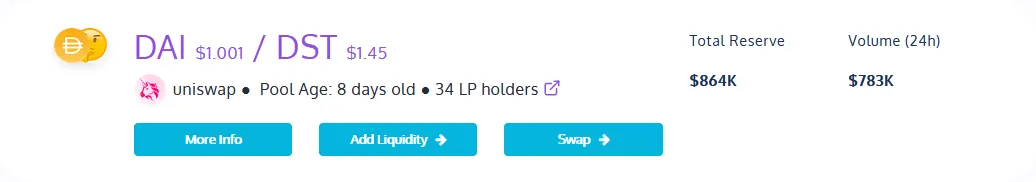
Pool age
Older pool implies less risk
While not a direct measure of risk, “age of pool” is similar to the “age of smart contract” proxy for security. The longer it goes without something horrible happening, the lower the likelihood something might happen (but with no guarantees).
Reserve size
Future/past price movement
Large price swings increase impermanent loss risk
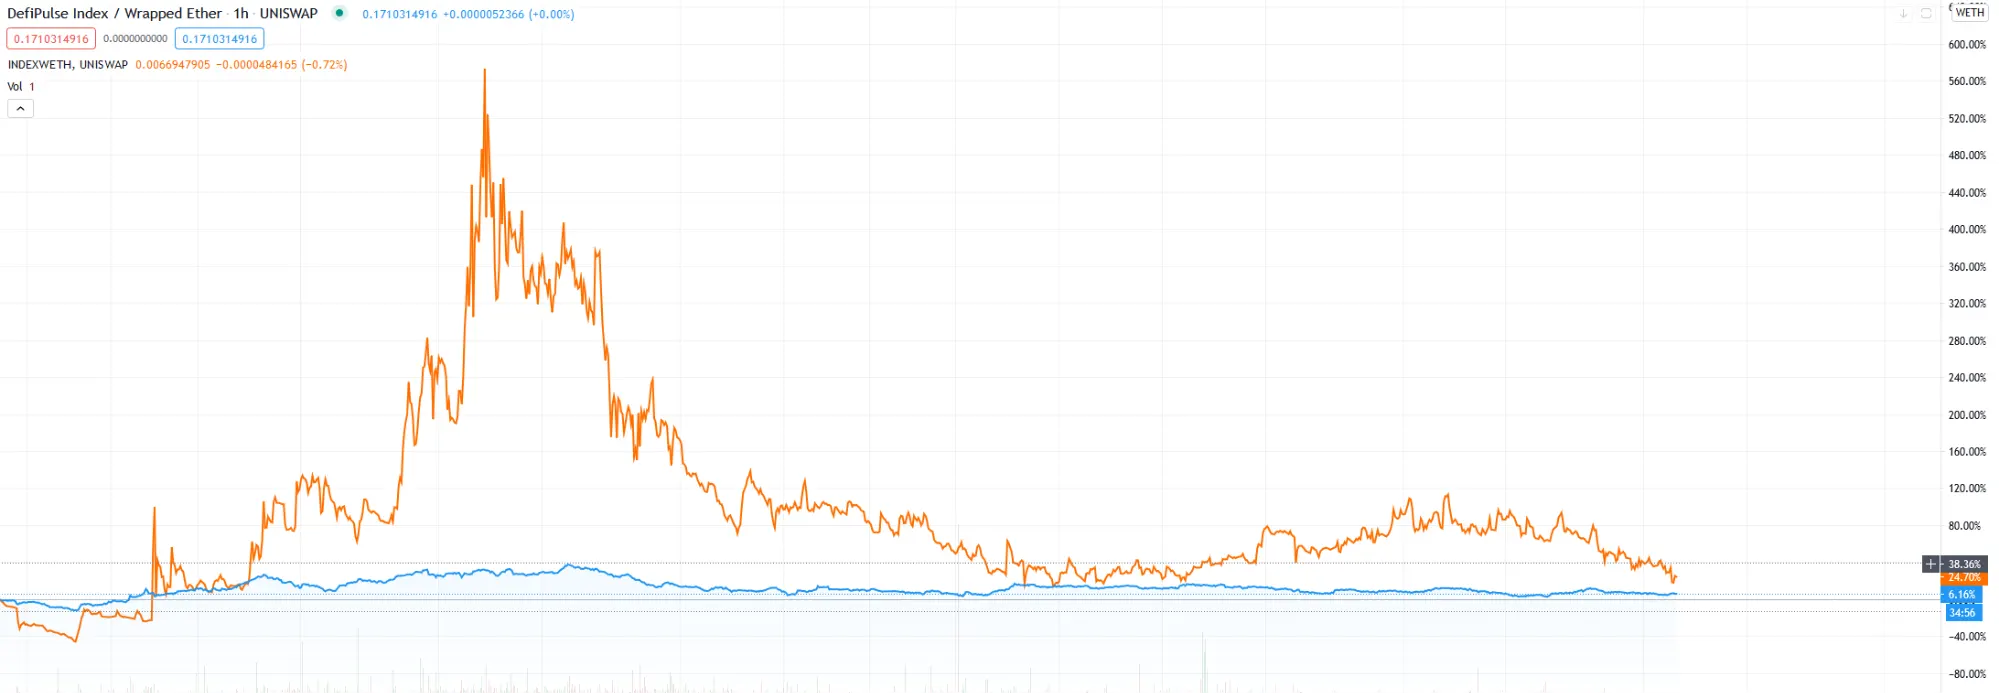
Chart from Tradingview that compares the two assets pairs, INDEX/ETH and DPI/ETH
The ideal scenario for liquidity pool holders is “sideways” trading with no large swings to the downside or the upside. Given that most pools’ base asset is ETH, you have to consider ETH price movement into your risk assessment. The pairs with the lowest impermanent loss are the tokens with the highest correlation to ETH’s price. In the above example, DPI is the relatively flat blue line as it had a reasonably tight correlation with the ETH price recently. The orange line that diverges significantly is the INDEX token, which had a loose correlation with the ETH price this year
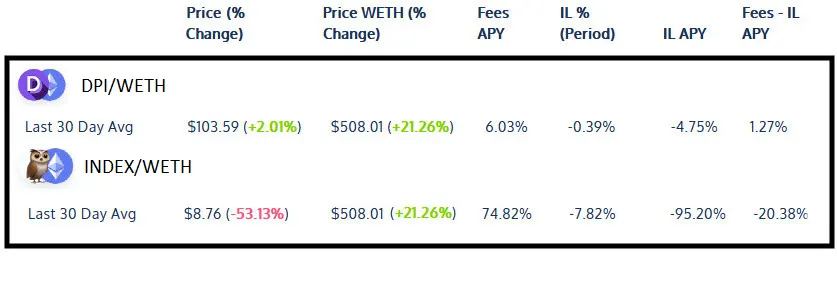
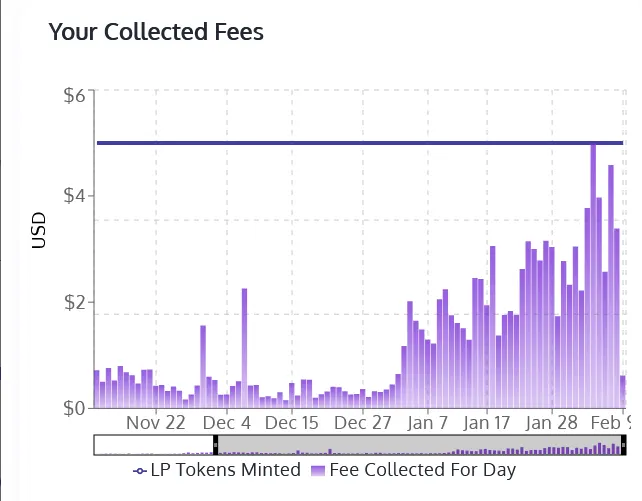
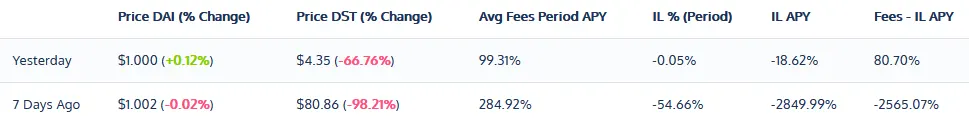
Data provided courtesy of APY.Vision
You can see from the data in the table above that returns can vary wildly depending on the various factors mentioned. That is why it is helpful to have advanced analytics to help find the best time to enter and exit pools.
The “Rug pull”
Malicious token/contract design can drain liquidity pools
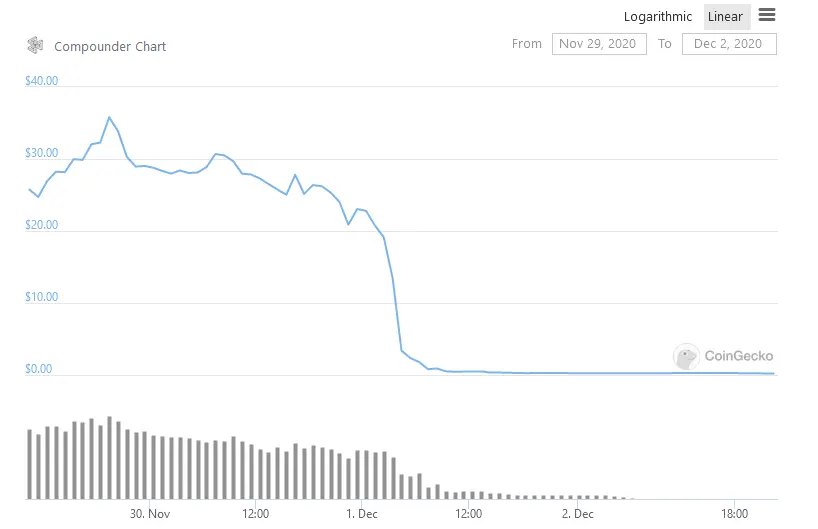
A visual representation of the Compounder rug pull from Coingecko
A prominent example of a recent rug pull was the scandal surrounding the Compounder project. What made it even more scandalous than usual was that a well-known security firm had audited the project, and the vulnerability was disclosed in the audit report. That did not seem to deter some investors as over $10 million was deposited into the pool before Compounder made malicious changes to the smart contracts to allow them to withdraw funds, stealing millions of dollars in the process.
How do you prevent being rug pulled? The easiest way to avoid sketchy projects that might engage in this activity is to use ranking sites that list projects that have been examined by professionals. DeFi Pulse and other projects help in this respect. The age and reputation of a project go a long way towards establishing credibility. Although some good anonymous developers in the crypto space exist, an anonymous team can raise suspicion as it makes it easier for a project to attempt a rug pull.
Conclusion
Given the variety of factors that can impact returns when providing liquidity to automated markets, it is plain to see that more advanced analytics can only help the average investor maximize their returns. That is our mission at APY.Vision, create the tools that allow pioneers in this new space of liquidity providing to maximize their returns, and minimize their risks.
